Photometrica Software – Measurement
Live Preview and Image Capture
Photometrica offers a complete set of controls for both the live preview and capture of measurements. Align and focus the instrument via the Preview function’s live video stream, while the Capture Editor manages the key measurement parameters such as exposure time.


Luminance
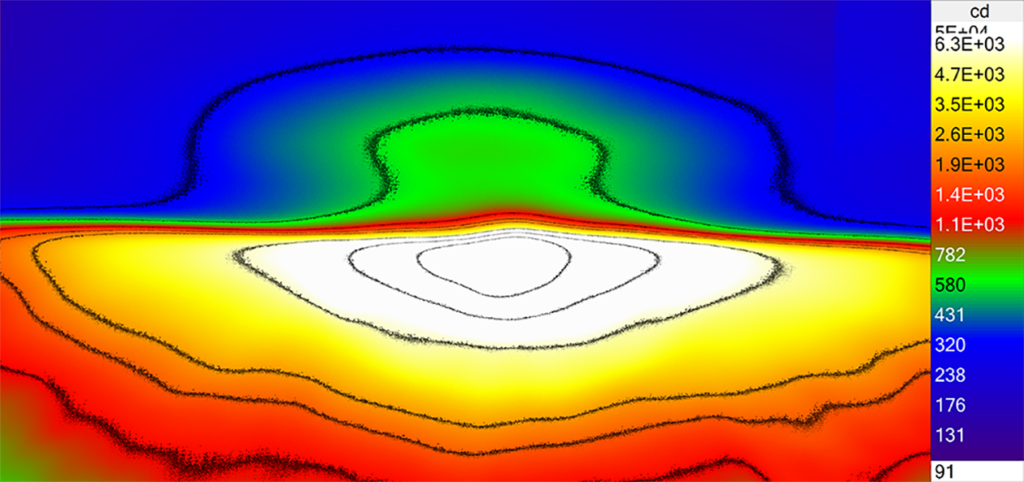
All WP imaging photometers and colorimeters measure luminance (Y) at high spatial resolution. Other photometric quantities that can be derived from luminance (cd/m2 or fL) include luminous intensity (cd) and partial luminous flux (lm).

Color
View chromaticity measurements in color space diagrams such as (x, y), (u’, v’), and various plots within Photometrica Software.
- color coordinates (x, y), (u’, v’)
- tristimulus values (X, Y, Z)
- dominant wavelength
- purity
- correlated color temperature (CCT)
WP imaging colorimeters come standard with four special filters to match the tristimulus functions: two for X (Xblue and Xred) and one for each of Y and Z.

Additional Filter Support
Photometrica supports other filters installed in photometers and colorimeters for various applications. Filter types include: scotopic, radiometric, bandpass, shortpass or longpass, ipRGC, S cone, M cone, and L cone.
Computed Measurements
Available computed quantities include:
- Illuminance
- Luminous Intensity
- Luminous Flux
- Radiance
- Spectral Radiance
- Irradiance
- Radiant Intensity
- Radiant Flux
- CIE Chromaticity Coordinates (xy and u’v’)
- Correlated Color Temperature (CCT)
- Dominant Wavelength
- Purity
- ΔE*ab
- Contrast
- Gamma and gamma inversion
- Custom computations can be generated to compute user-specified measurement components on a pixel-wise basis
Spectral Measurements
The WP512, WP6ES, WP525 and MCIC-S imaging spectral colorimeters have an integrated spot spectroradiometer providing automatic color correction, and markedly improving accuracy. Benefit from fast spectral preview, spectral radiance graphing, tabulated measurement results from the spectra, and more.

Measuring Modulated Displays and Sources with Temporal Anti-Aliasing High Dynamic Range (TAA HDR)
Westboro Photonics’ patent-pending TAA HDR imaging technology optimizes measurements with spectrometers, imaging photometers, and colorimeters, improving the speed, precision, and repeatability of measurements for modulating sources and displays.
Experienced metrologists will be aware that temporal aliasing in measurements can be insidious. It can lead to small or large errors that may or may not be easy to notice, diagnose, or correct. The TAA HDR method fixes temporal anti-aliasing – automatically, without user intervention.
The Temporal Aliasing Challenge
HDR imaging is essential in both photography and light measurement applications. Traditional Multi-Exposure Fusion (MEF) HDR captures multiple images at different exposure levels, combining them into a single HDR image. However, when sensors image modulated light sources with short integration times, temporal measurement errors can arise, leading to inconsistencies in HDR stitching and unreliable results.
Temporal errors are commonly mitigated through techniques such as averaging measurements, or constraining to allow only long exposures (via attenuating filters or iris). However, those methods often add MTF degradation, added mechanical complexity, added cost, degraded spectral matching, and reduced dynamic range.


Illustrations of PWM duty cycle with short exposures and asynchronous sampling (top) versus long exposure integrating over multiple duty cycles (bottom).
TAA HDR Principle
The TAA HDR method addresses image exposure stitching mismatches by automatically anchoring the values from the longest exposure to the successively shorter exposures in the HDR sequence. Pixel data values that are valid in two successive exposures are compared, and all image data from the shorter exposure are uniquely scaled to match the values from the longer exposure. Then the two exposures are fused. The process repeats until all exposures are complete.

Spectrum plots of standard HDR measurements (left) with unrepeatable results, and TAA HDR measurements (right) with improved precision and accuracy. Source modulated at 45Hz, 20% duty, 100% modulation, and square wave to highlight the technology’s capabilities.

Luminance measurements and corresponding profile line plots showing HDR (left) with unrepeatable results, and TAA HDR measurements (right) with improved precision and accuracy. Source modulated at 45Hz, 20% duty, 100% modulation, and square wave to highlight the technology’s capabilities.
This patent-pending TAA HDR method is now available with Photometrica 8.2 software, supporting Westboro Photonics’ spectrometers, imaging photometers, and colorimeters.
Request for Information
Software Features Defined
Specialized Software Packages
Instruments
Let us help you find the right software for your needs